MarTech · Data · 2026
Running Bitunix marketing from one screen
I replaced an hour of daily spreadsheet work with one dashboard that joins Google Search Console, GA4, and the Bitunix Partner Portal into a single funnel — so budget decisions rest on deposits, not clicks.
I run marketing for Bitunix. My job is to grow organic search, turn that traffic into partner signups, and prove which channels bring real deposits. I answer to numbers, not opinions.
The problem I had
Every morning I opened three browser tabs. Google Search Console for organic search. GA4 for on-site behavior. The Bitunix Partner Portal for signups, deposits, and commissions. Each tab spoke its own language, and none of them talked to each other.
So I spent the first hour of my day copying numbers into a spreadsheet. I lined up dates by hand. I guessed which search campaign drove which deposit. My attribution was a hunch, not a fact. When my manager asked “which campaign paid for itself,” I gave a soft answer. I also missed things — the partner token expires after 180 days, and twice it lapsed without warning and the data went stale for a week before I noticed.
What I built to fix it
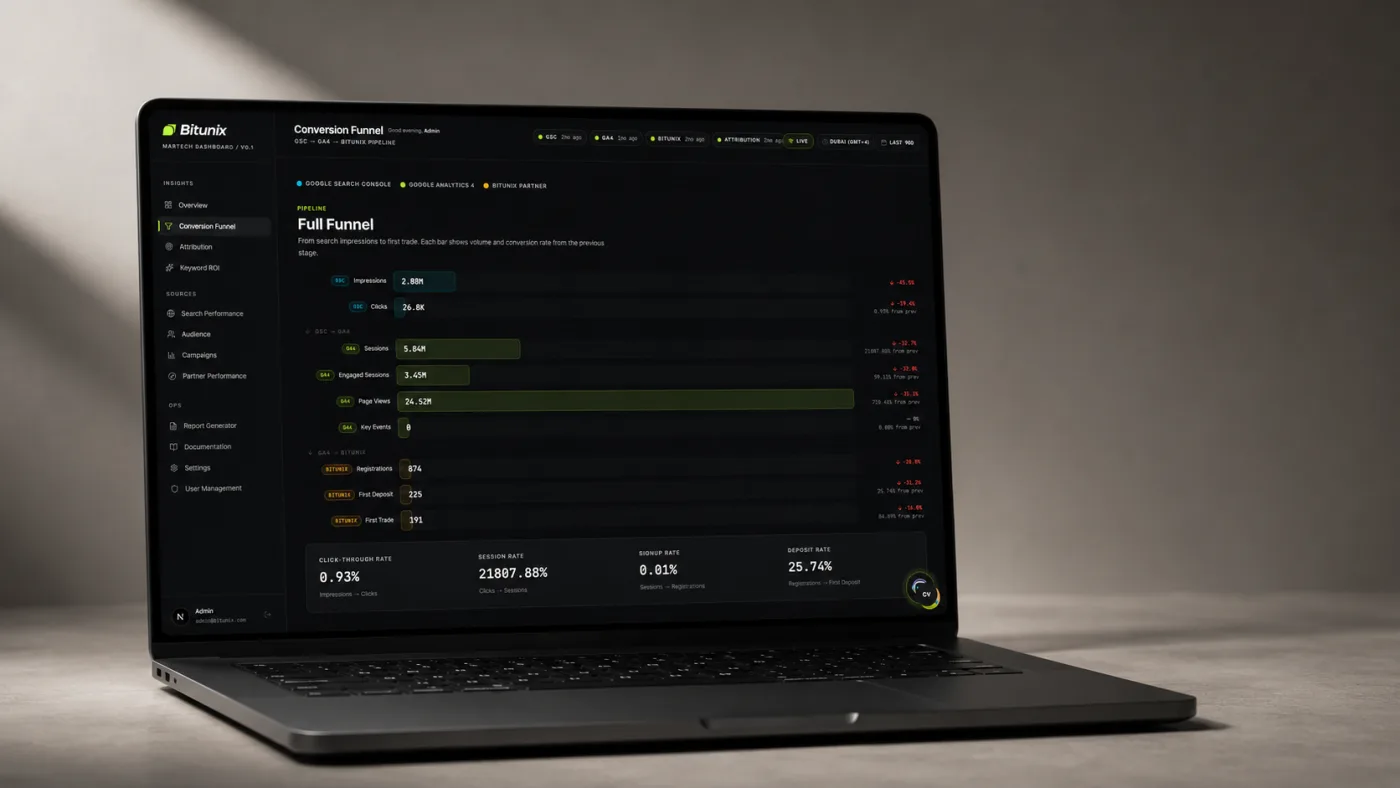
I built the Bitunix MarTech Dashboard. It pulls from all three sources every morning and joins them into one funnel: a Google search click becomes a GA4 session becomes a partner signup becomes a first deposit. One screen, one story.
The stack is a Laravel 13 API on PostgreSQL and Redis, and a Next.js 16 dashboard. The API refreshes Search Console at 02:00, GA4 at 02:30, and the Partner Portal at 03:00, every day, in sequence. By the time I sit down, the numbers are ready. Every page defaults to the last 90 days, and every KPI shows a delta arrow against the previous window of equal length — with the colors flipped for average search position, because moving from 5 to 3 is a win.
My 10-second morning check
I open the Overview page first. It answers one question: is anything broken or moving? One lead card with total fees and a sparkline, four KPIs below it, and a funnel widget from search clicks to first deposits.
Here is a real morning. Fees read 12,400 USDT, up 18%. Search clicks up too. But registrations showed a red arrow at −22%. In 10 seconds I knew traffic was up and signups were down — so the problem lived on the landing page, not in acquisition. I went straight to the right fix instead of hunting. Before the dashboard I would not have caught that gap for days.
Finding which campaign actually pays
The Attribution page is the reason I built this. It joins Search Console clicks, GA4 sessions, and Bitunix signups by UTM source, medium, and campaign. Every row shows clicks, sessions, signups, first deposits, first trades, and trading volume side by side.
Last quarter I ran two campaigns at the same budget. Campaign A drove 4,100 clicks; Campaign B drove 2,700. On clicks alone A looked like the winner. The table told the truth: A produced 6 first deposits, B produced 19. Campaign B brought triple the deposits from fewer clicks. I moved the budget the same afternoon.
Clicks flatter you. Deposits pay you. The dashboard shows both in the same row so I never confuse the two again.
Cutting my dependence on brand traffic
The Search Performance page splits every query into branded and non-branded. Branded traffic feels good and means little — those people already know Bitunix. Non-branded traffic is real growth. When I first looked, branded clicks were 71% of my organic total. That scared me: SEO was riding on brand awareness, not earning new demand.
I used the non-branded keyword table to find queries with impressions but weak position — several near position 8 with strong impression counts. I wrote content for them. Ninety days later, non-branded clicks grew and the branded share dropped to 58%.
Catching the token before it broke
The Settings page shows the Bitunix token status and an audit log of every data job — expiry date, last refresh, records processed, and any error. One morning the token showed 9 days to expiry. In the old world I would have learned about that only after the data went stale. This time I rotated the token in two minutes and the partner data never skipped a day. The audit log also caught a failed GA4 job once; I fixed the cause before lunch instead of finding a hole in my numbers a week later.
What changed
- 1 hr → 10 s daily reporting time
- 71% → 58% brand-traffic dependence in a quarter
- 3 → 1 sources, joined on one screen
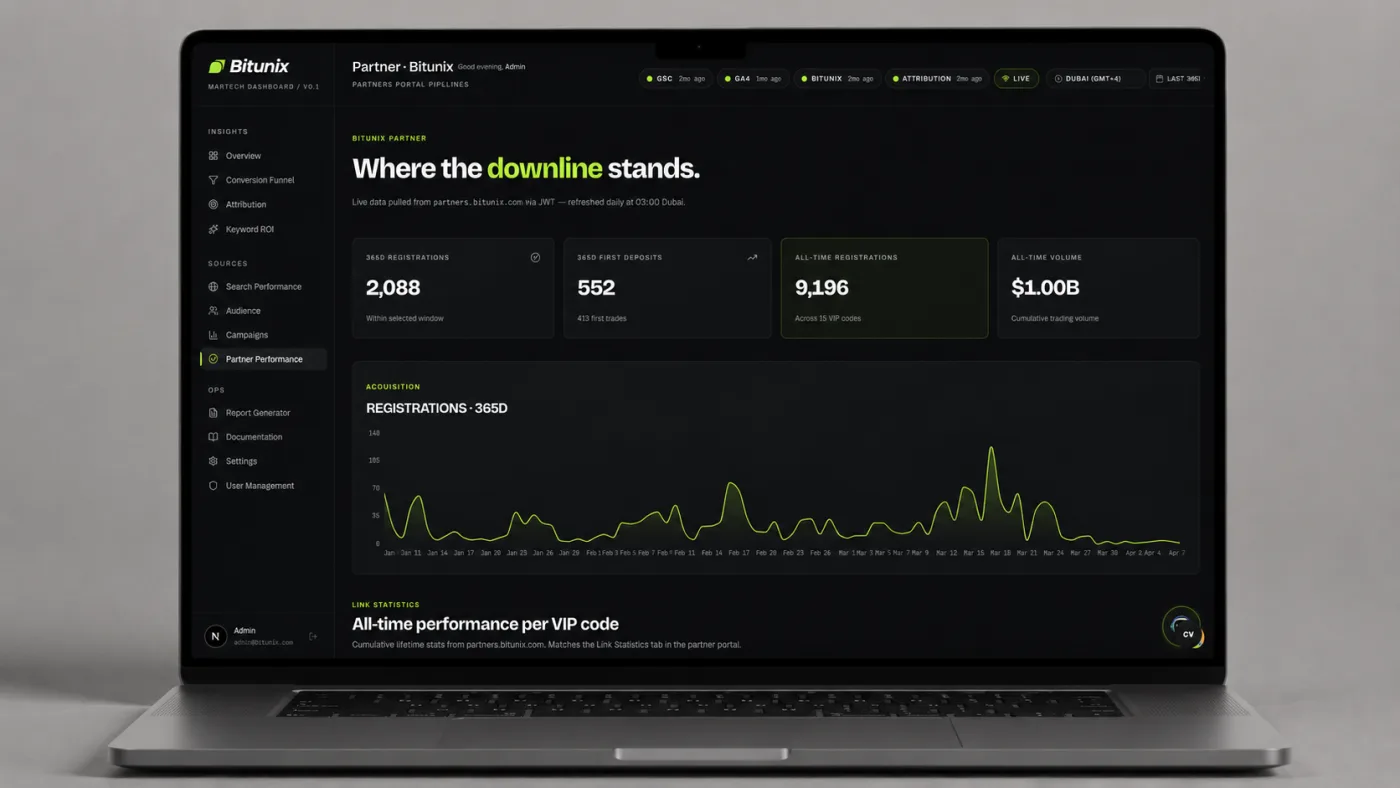
- $1.00B partner trading volume tracked
My budget decisions now rest on deposits, not clicks. My partner data has not gone stale since I started watching the token. And the biggest change is the answer I give my manager — when someone asks which campaign paid for itself, I open the Attribution page and point at the row. The hunch is gone.
How you can apply this
You don’t need three tools open at once. Pick your three core sources and join them on one shared key — for marketing that’s usually the UTM tag and the date. Lead with the metric that pays you, not the one that flatters you. Compare every number to the same window before it. And watch the boring operational things: a token that expires quietly will cost you a week of blind data.